 ChampLeagueFinalBet
 Late Goals: Time of Goal Betting Patterns
 Available in US
The timing of goals in Champions League finals follows distinct patterns that bookmakers imperfectly price. Late goals, particularly in the 75-90 minute window, occur at elevated rates compared to earlier periods. Understanding these timing patterns creates opportunities in time-of-goal markets that casual bettors overlook.
Finals produce drama precisely because decisive goals often arrive when tension reaches maximum. This is not coincidence but a predictable consequence of final dynamics that informed bettors can exploit.
Capture the drama on our live final hub.
The Late Goal Phenomenon
Across Champions League matches generally, approximately 23% of all goals arrive in the final fifteen minutes plus stoppage time. In finals specifically, this percentage increases because the first seventy-five minutes often produce stalemates that only break as fatigue and desperation intensify.
The 75-90 minute window produces more decisive final goals than any other period. Sergio Ramos's 93rd-minute equaliser against Atletico in 2014, Teddy Sheringham and Ole Gunnar Solskjaer's injury-time strikes against Bayern in 1999, and numerous other iconic moments arrived in this window.
Physical exhaustion explains much of this pattern. Defenders who maintained concentration and positioning for seventy-five minutes lose sharpness as muscles tire. The mental demands of final football compound physical fatigue, creating moments of lapsed focus that attackers exploit.
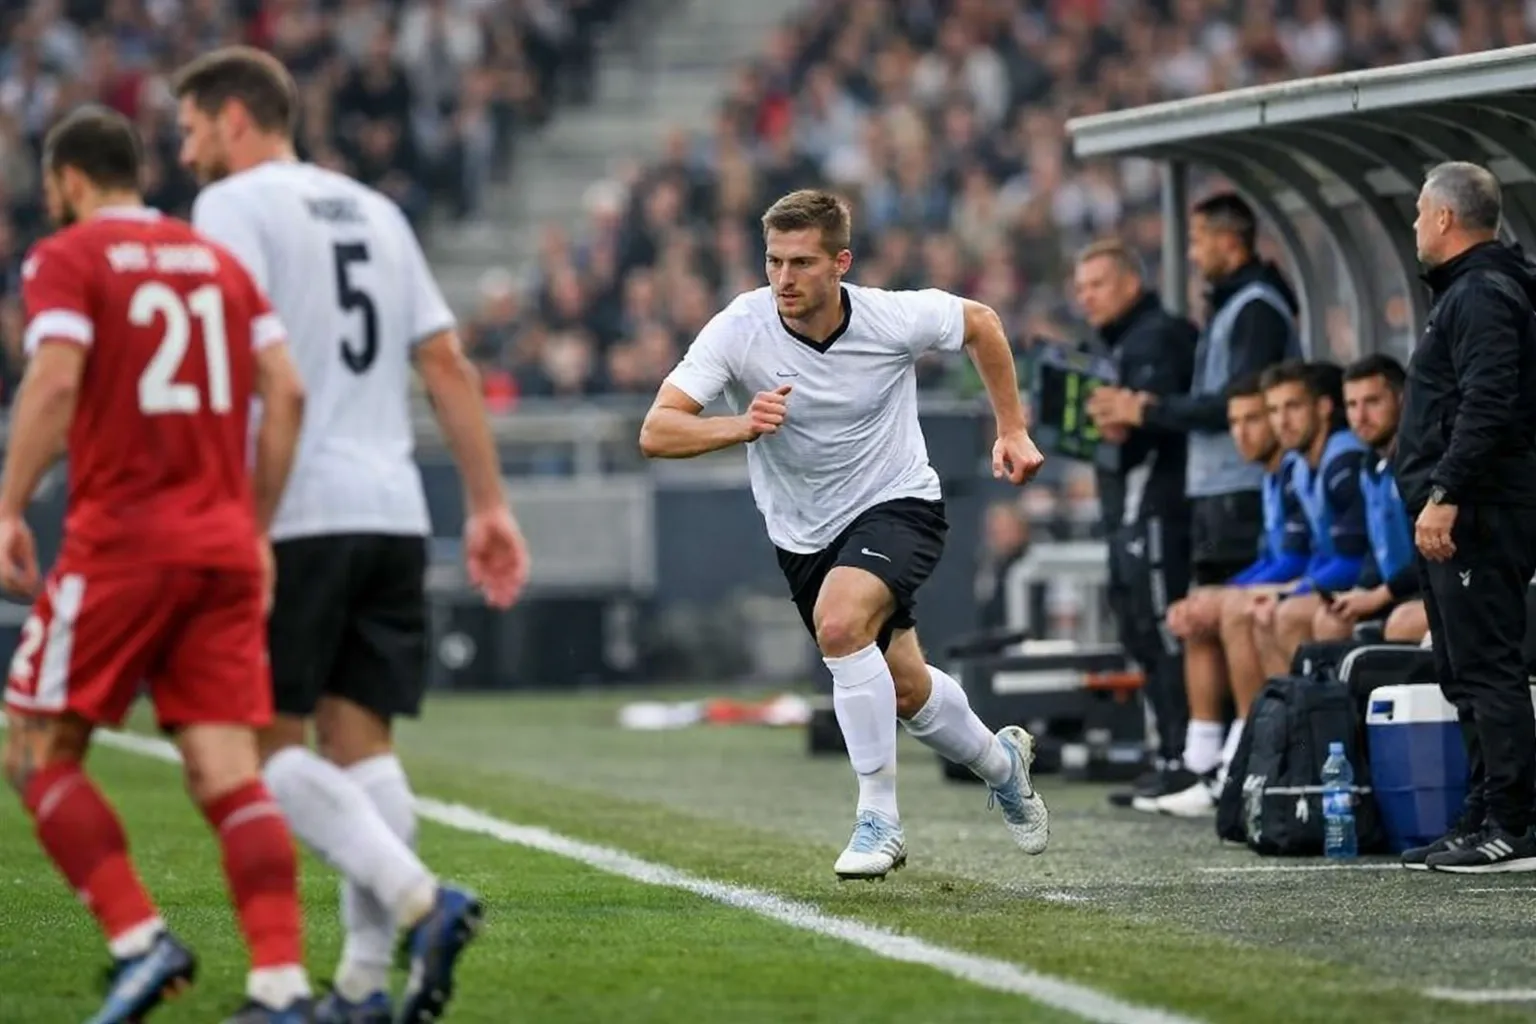
Tactical changes also peak in this period. Managers introduce attacking substitutes, shift formations to chase games, and abandon defensive caution. These changes open spaces that did not exist when teams prioritised defensive structure.
First Half Goal Patterns
First halves in finals are remarkably quiet. Only 43% of finals produce any first half goals, and even fewer produce multiple first half goals. The most common first half scoreline is 0-0.
This pattern reflects mutual caution in the opening period. Neither team wants to make the error that decides the final. Players described as fearless in semi-finals become conservative when the trophy is visible. Managers instruct patience and discipline rather than aggressive pressing.
The timing within goalless first halves shows increasing probability as halftime approaches. Goals in the 0-15 minute window are rare because both teams are still settling. Goals in the 35-45 minute window are more common as teams tire of caution and begin creating genuine chances.
Betting implications favour unders on first half goal totals. First half under 0.5 goals at +150 or better offers value given the 57% rate of scoreless first halves. First half under 1.5 goals at -200 or shorter becomes less attractive but remains positive expected value.
Second Half Timing Windows
The second half divides into distinct betting windows with different characteristics.
The 46-60 minute period sees increased activity as managers make halftime adjustments. Teams return with renewed energy and refined tactics. Goals in this window often come from set pieces or quick breaks before defences settle into second half rhythm.
The 60-75 minute window corresponds with the first wave of substitutions. Fresh attackers entering against tired defenders create mismatches. The team that executes substitutions better gains advantage that can translate into goals.
The 75-90 minute window, including stoppage time, produces the highest goal density. Everything intensifies: desperation from trailing teams, counter-attack opportunities for leading teams, fatigue-induced mistakes, and increased risk-taking from managers who see time expiring.
Markets for goals in specific time windows allow targeted betting on these patterns. Backing "goal in 76-90 minutes" at +200 offers value when historical rates suggest approximately 35-40% probability of a goal in that window.
Stoppage Time Specifics
Added time in finals typically extends beyond regular matches. Referees allow play to continue through substitutions, injuries, and celebrations that accumulate over ninety minutes of high-stakes football. Four to six minutes of stoppage time is standard.
Goals in stoppage time decide finals with notable frequency. Manchester United's 1999 comeback, Real Madrid's 2014 equaliser, and several other dramatic conclusions came after the 90th minute.
Markets specifically targeting stoppage time goals offer long odds that occasionally represent value. "Goal in added time" might price at +400 or longer, but the approximately 15% historical rate in finals suggests anything beyond +500 offers positive expected value.
The psychological dimension of stoppage time creates unpredictability. Leading teams defend desperately while trailing teams throw everyone forward. These conditions produce both goals and near-misses in quick succession.
High-pressure goals are a staple of our live betting guide.
Extra Time Goal Patterns
When finals extend beyond ninety minutes, goal patterns shift again. The first half of extra time (91-105 minutes) produces more goals than the second half (106-120 minutes).
Players begin extra time with energy recovered during the break before extra time. This renewed energy creates attacking momentum that produces chances. However, fatigue reasserts itself quickly, and the second half of extra time often becomes attritional.
Goals in extra time often come from substitutes. Managers save one or two changes specifically for extra time, introducing fresh legs against exhausted opponents. Mario Gotze's 2014 World Cup final winner exemplified this pattern, though it applies equally to Champions League extra time.
Backing "goal in extra time" during a 0-0 regulation stalemate offers value because 75% of extra time periods produce goals. The market may price this around -200, but true probability is approximately 75%, creating clear expected value.
Time of First Goal Markets
Markets asking when the first goal will arrive allow betting on overall match tempo rather than specific timing windows.
First goal in first half versus first goal in second half or no goal provides a three-way market. Given that 57% of finals are goalless at halftime and roughly 20% remain goalless after regulation, the probability distribution weights toward second half or no goal.
More granular markets break timing into 15-minute windows. First goal in 0-15, 16-30, 31-45+1, 46-60, 61-75, 76-90+, or no goal provides seven-way markets with varying odds.
Historical patterns show first goals clustering in the 46-75 minute range rather than early or very late. Teams require time to settle before creating chances, but also prefer to score before final-period desperation produces chaotic play.
Live Betting on Goal Timing
Live markets adjust goal timing probabilities based on elapsed time and current scoreline. As a goalless match progresses, markets for "goal before X minute" extend while "no goal" compresses.
Value appears when markets underestimate the increased late-goal probability in finals. A 0-0 match at 70 minutes might price "goal in remainder" at -150, implying 60% probability. But finals produce goals in this window approximately 70% of the time, creating value.
The inverse opportunity exists on "no goal in match" when regulation time expires goalless and extra time begins. Markets might price "no goal in extra time" at +300, but historical 25% probability suggests value exists at +350 or longer.
Combining Timing with Scoreline
Goal timing probabilities depend on current scoreline, not just elapsed minutes.
A 0-0 final at 75 minutes has different late-goal probability than a 1-0 final at 75 minutes. In goalless matches, both teams push forward, increasing total goal probability. In 1-0 matches, the leading team defends while the trailing team attacks, potentially decreasing total goal probability while concentrating whatever goals do occur on the trailing team's attempts.
Markets that combine timing with scoreline, such as "next goal in 76-90 by trailing team," offer complex probability assessments. Breaking down the components: probability of a goal in that window, probability that the trailing team scores rather than the leading team, and probability that the scoreline remains unchanged until that window.
These complex markets often contain pricing inefficiencies because bookmakers use simplified models. Bettors who think through conditional probabilities can identify value.
Practical Application
Building a goal timing strategy for finals involves several steps.
Pre-match, assess whether this specific matchup is likely to follow typical final patterns or deviate. Two attacking teams might produce earlier goals than two defensive teams. Adjust timing expectations accordingly.
During the match, compare your timing expectations to live market prices. If the match is goalless at 60 minutes and you believe late goals are likely, identify the window where prices offer maximum value relative to your probability estimates.
Track your timing-based bets separately to assess whether your probability estimates are accurate. If you consistently overestimate late-goal probability, your model needs adjustment. If your estimates are accurate but you are taking poor prices, your timing or line shopping needs improvement.
The goal timing dimension adds complexity to final betting but also adds opportunity. Markets that assume generic timing patterns fail to account for final-specific dynamics. Bettors who understand these dynamics capture value that simpler approaches miss.
